Technical Analysis of TT 2024-05-10
Overview:
In analyzing the technical indicators for the stock over the last 5 days, we will delve into the trend, momentum, volatility, and volume indicators to provide a comprehensive outlook on the possible stock price movement in the coming days. By examining these key indicators, we aim to offer valuable insights and predictions for informed decision-making.
Trend Analysis:
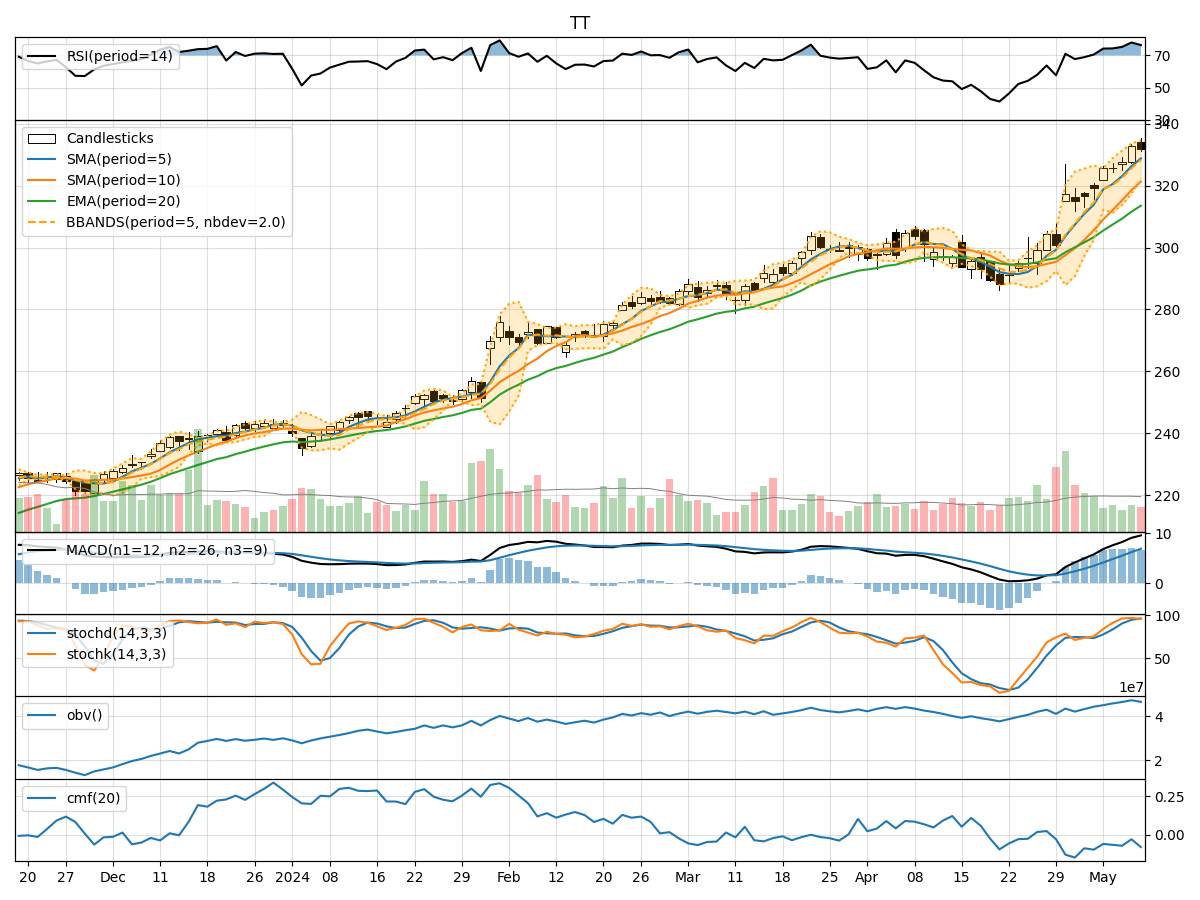
- Moving Averages (MA): The 5-day Moving Average (MA) has been consistently rising, indicating a bullish trend in the short term.
- MACD: The Moving Average Convergence Divergence (MACD) has shown positive values, with the MACD line consistently above the signal line, suggesting bullish momentum.
Momentum Analysis:
- RSI: The Relative Strength Index (RSI) has been fluctuating but generally staying in the overbought territory, indicating strong buying momentum.
- Stochastic Oscillator: Both %K and %D have been in the overbought zone, suggesting a potential reversal or consolidation.
Volatility Analysis:
- Bollinger Bands (BB): The Bollinger Bands have been widening, indicating increased volatility in the stock price.
Volume Analysis:
- On-Balance Volume (OBV): The OBV has been fluctuating but generally showing an uptrend, suggesting accumulation by investors.
- Chaikin Money Flow (CMF): The CMF has been negative, indicating selling pressure in the stock.
Key Observations:
- The stock is currently in a bullish trend based on moving averages and MACD.
- Momentum indicators like RSI and Stochastic Oscillator suggest a strong buying momentum but also hint at potential overbought conditions.
- Volatility has been increasing, as seen in the widening Bollinger Bands, indicating higher price fluctuations.
- Volume indicators show mixed signals, with OBV indicating accumulation while CMF suggests selling pressure.
Conclusion:
Based on the analysis of the technical indicators, the stock is likely to experience further upward movement in the coming days, supported by the bullish trend and momentum. However, caution is advised due to potential overbought conditions highlighted by momentum indicators. Traders should closely monitor price action for signs of a reversal or consolidation. Overall, the outlook for the stock remains bullish in the short term, but vigilance is key to navigating potential market shifts.